


STEP-BY-STEP GUIDE IN ACCESSING THE INTERACTIVE TRADE STATISTICS
GUIDE IN ACCESSING THE INTERACTIVE TRADE STATS
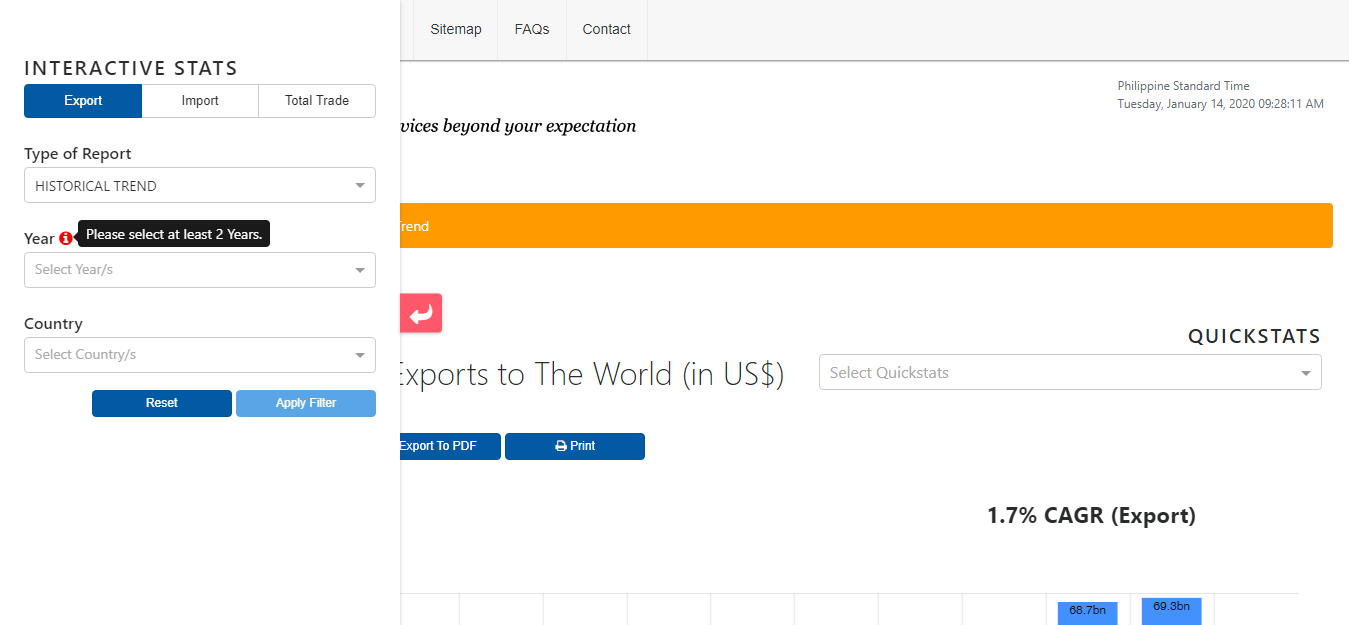
- The left pane shows the interactive “FILTERS” which allows users to generate different types of reports.
- The pink icon below with an arrow inside is the clickable icon for displaying or hiding the “filter” pane.
- The right pane shall initially show the “DEFAULT” type of report. In this instance, the default report for “Export” is the Historical Trend from 2006 to 2018.
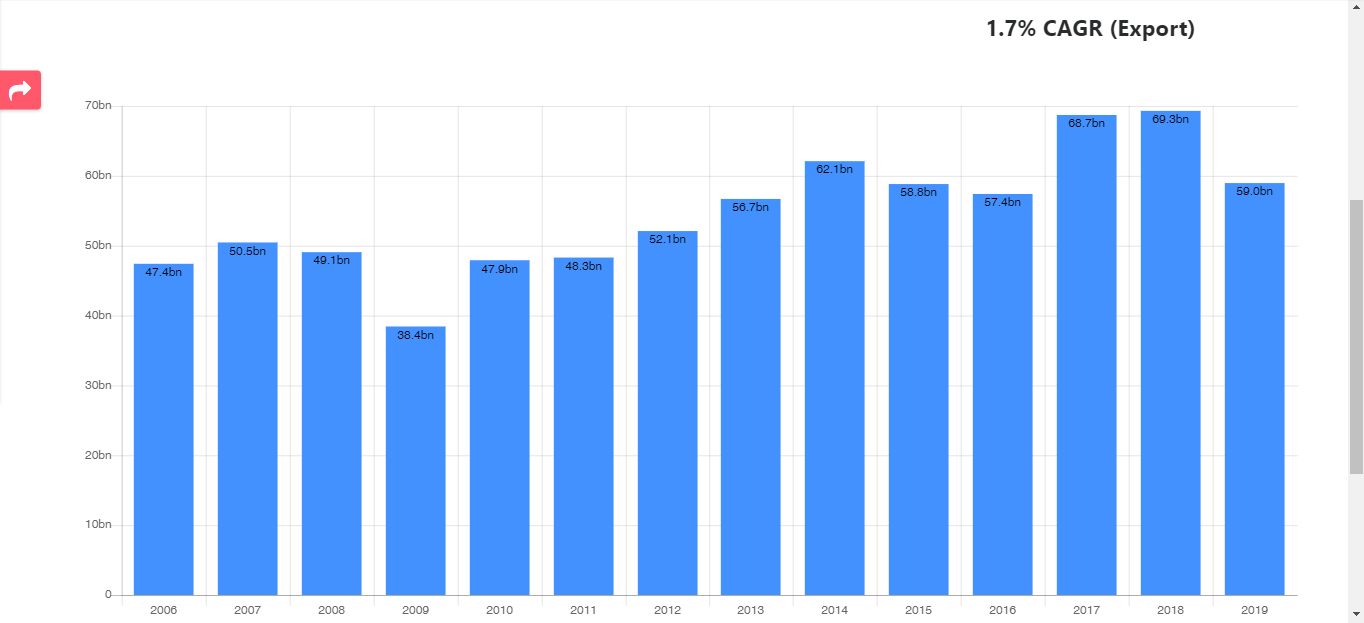
To see the default graph, please click the pink icon to hide the left filter pane. The following screenshot of the Export Historical Graph shall appear:
Export Report Templates
- For generating the Export Report templates, please click the pink icon again in the previous screenshot to display the filter pane. The screenshot below with filters will be displayed.
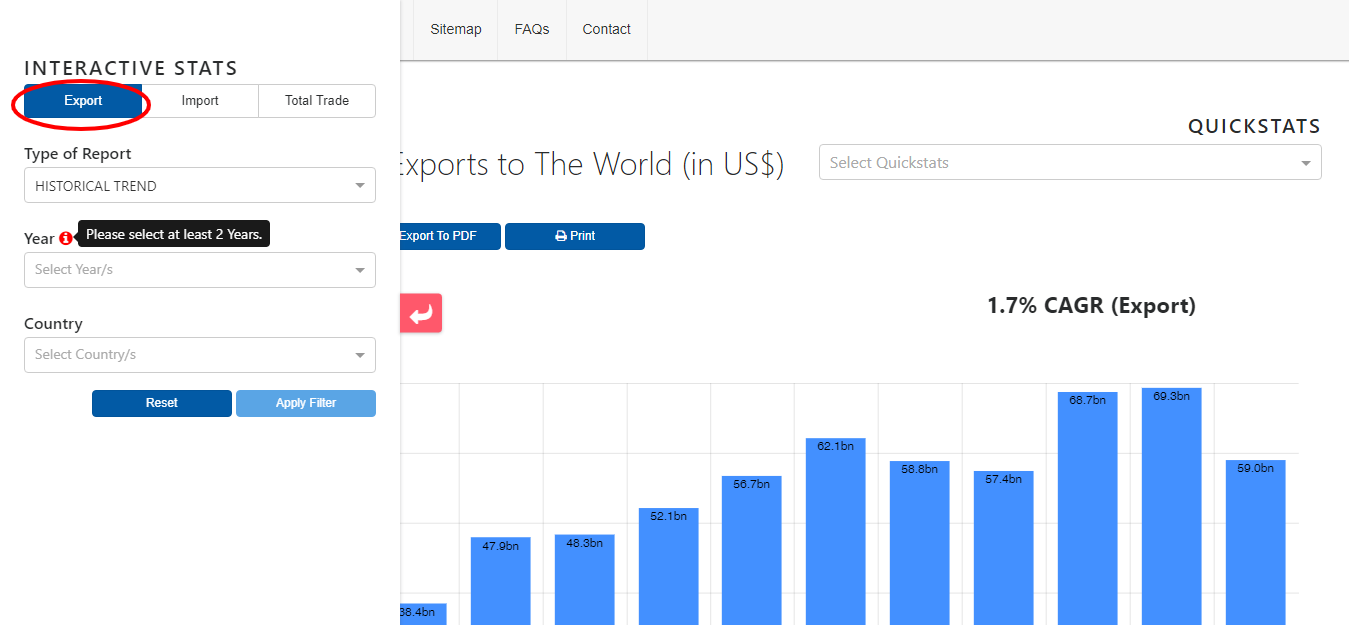
- Choose the type of data you would like to access : [Export/Import/Total Trade]
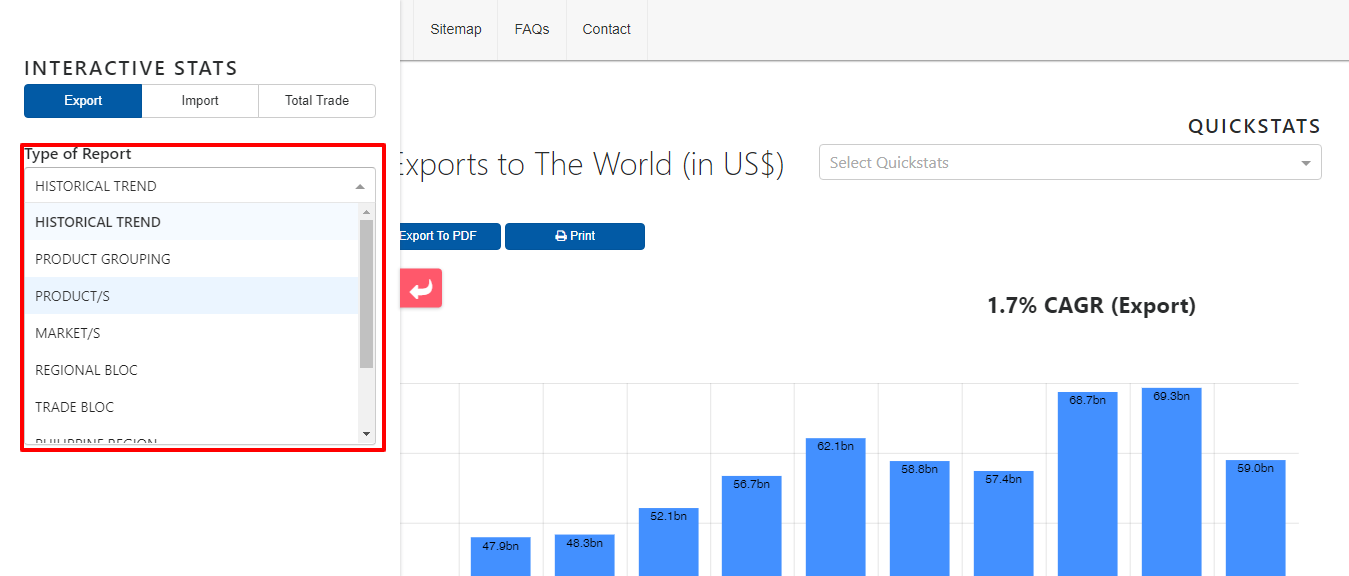
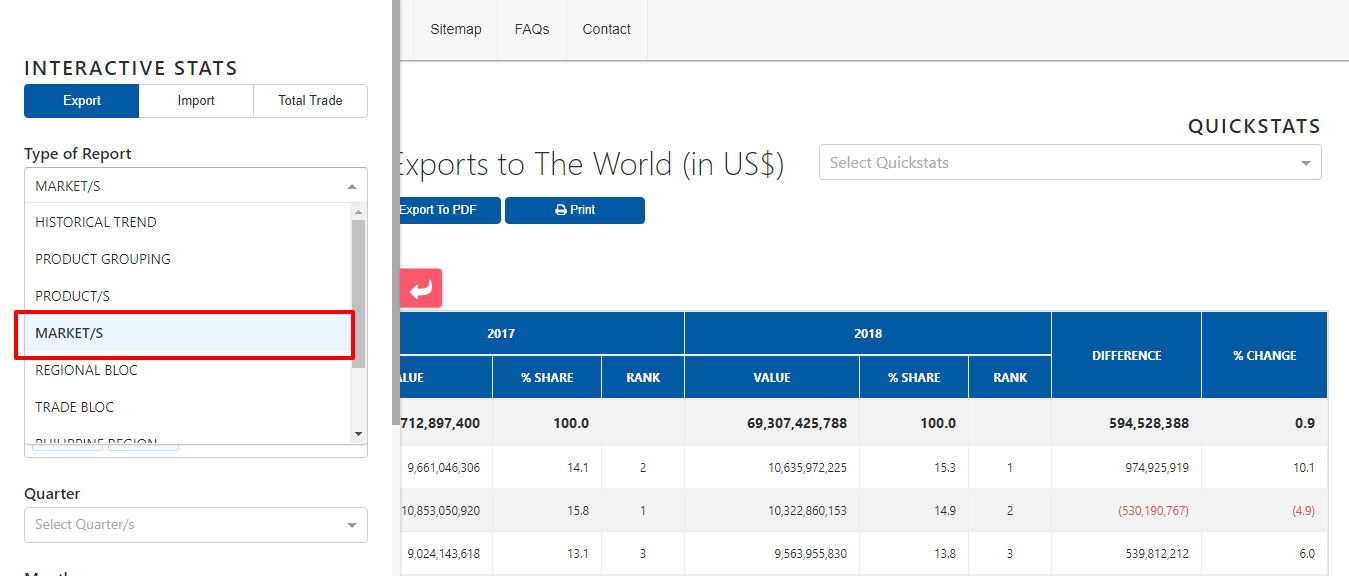
- If, you chose “EXPORT”, please choose the Type of Report that you would like to generate from the drop down menu:
-
Please select the type of report you want to generate together with the corresponding applicable filters for the type of report you selected.
-
If you want to generate the Export Template by Market/s, please select the Market/s from the Type of Report dropdown menu:
IMPORTANT NOTES:
- All types of reports have default graph and Excel templates.
- Users can generate various types of reports based on the filters that they fill out.
- Outputs can be downloaded and printed using the icons found at the upper part of the screen.
- For Import and Total Trade, please apply the same step-by-step procedure in accessing interactive stats[i.e. as shown in the above procedure for Export templates].
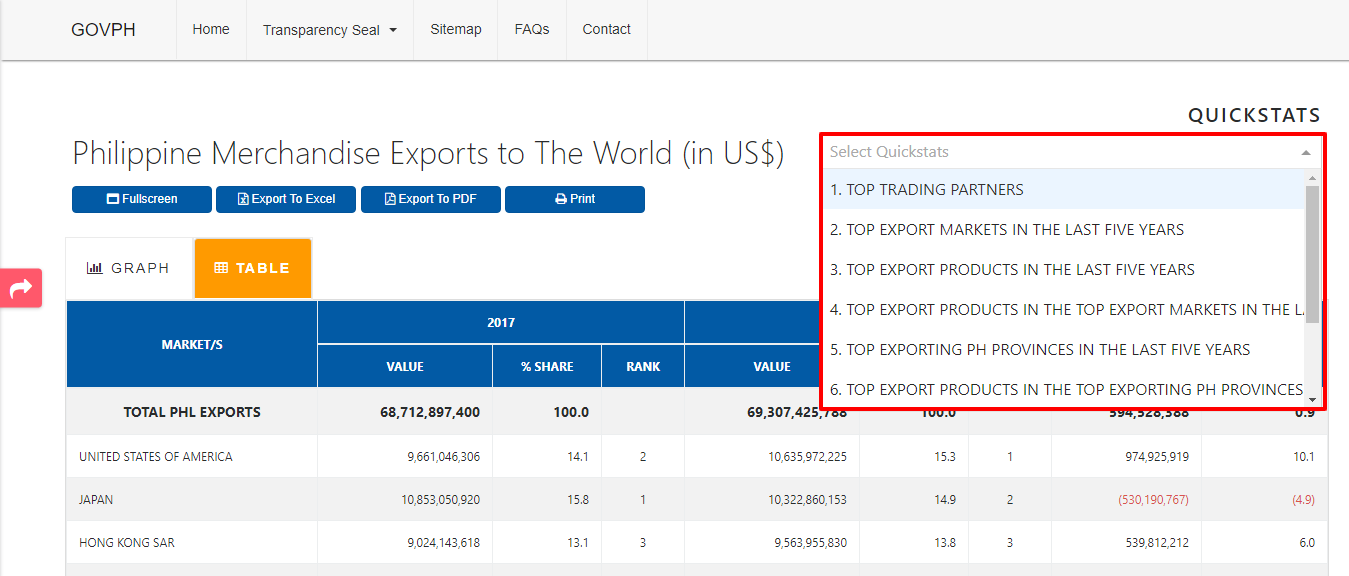
- Quickstats can be generated using the icon at the rightmost side which has a drop-down menu for different types of reports. These reports are based on the latest 5-year historical data.
Back to Interactive Trade Statistics